
PLC fault codes and HMI alarms: how to trace an alarm back to its root cause
A PLC fault code or HMI alarm tells you where troubleshooting starts, not why the machine stopped. A field method for tracing an alarm from its text to the device behind it.
How do you trace a PLC fault code or HMI alarm to its root cause?
A PLC fault code or HMI alarm tells you where troubleshooting starts, not necessarily why the machine stopped. Manufacturer fault codes can often be decoded from vendor documentation. Custom HMI alarms usually require tracing the alarm bit into the PLC logic, following the failed interlock or permissive, checking its live value, and identifying the physical device behind it.
When a production line stops, the HMI may give you something that looks useful: CONVEYOR 2 NOT READY. Or the controller may report a specific fault code. Both are clues, but they are very different kinds of clues.
A manufacturer fault can often be looked up. A machine alarm has to be traced.
That distinction matters because much of the downtime on a real production floor is not caused by a mysterious processor fault with a clean manual entry. It is caused by a machine-specific condition buried inside the control logic: a missing permissive, an open safety circuit, a drive that is not ready, a handshake from another controller that never arrived, or a sequence that timed out because one physical condition was not satisfied.
The useful question is therefore not just “What does this alarm mean?” It is:
What condition in the machine caused this alarm to become true?
That is the chain this guide follows.
Two kinds of alarm, two kinds of answer
Manufacturer-defined faults belong to the controller, I/O module, drive, servo, safety system, or other device. A ControlLogix major fault, a Siemens diagnostic event, or a drive overcurrent code has a published definition. If you know the exact device and code, vendor documentation is often the right place to start.
Machine alarms are different. Messages such as “Station 3 not ready,” “Conveyor 2 sequence timeout,” or “Filler permissive missing” were created by the machine builder, system integrator, OEM, or plant controls team. Their meaning exists inside that machine’s PLC program. There may be no manual and no useful search result. To understand them, you have to follow the logic.
What does a PLC fault code actually tell you?
A PLC fault code usually identifies the subsystem that detected a problem and a defined fault condition, but it does not always identify the physical root cause. Start by determining whether the event comes from the controller, an I/O or network connection, a drive or motion device, the safety system, or machine-specific process logic. There is a useful hierarchy:
- 01Controller faults. Processor-level conditions such as major recoverable or non-recoverable faults, watchdog problems, memory issues, or execution errors. In Rockwell Logix systems, major faults are reported using a Type/Code format such as Txx:Cxx and can be reviewed in the controller fault information.
- 02I/O and communication faults. A controller may be healthy while an I/O module, remote rack, EtherNet/IP connection, or PROFINET device is unavailable. The first useful question becomes: which connection failed, and what depends on it?
- 03Drive and motion faults. A VFD or servo may report overcurrent, STO active, encoder problems, not-ready conditions, following errors, or other device-specific faults. The drive’s own diagnostic code is often the first lookup point.
- 04Safety faults. Safety controllers, safety I/O, guard circuits, light curtains, emergency stops, and safety task faults have their own diagnostic paths. These conditions should be investigated using the machine’s approved safety procedures, never bypassed simply to test a theory.
- 05Process and machine alarms. These are often the most interesting. They are generated by the application logic itself. The HMI may display a clear sentence, but the sentence is only the label attached to a Boolean condition somewhere in the program.
For manufacturer-defined faults, use the manufacturer’s own diagnostic path first. Rockwell provides Logix controller and I/O fault documentation and major fault information in Studio 5000. Siemens exposes controller diagnostics through Online & diagnostics and the diagnostic buffer in TIA Portal. CODESYS provides online monitoring and device and application diagnostics, depending on the runtime and device implementation.
The published definition tells you what the platform detected. The PLC logic and live machine state tell you why it happened on this machine.
Common PLC fault and alarm classes
| Fault class | Where it shows up | What it usually means | First check | Tool that reads it |
|---|---|---|---|---|
| Major recoverable or non-recoverable controller fault | Controller status, fault log, engineering software | The controller detected a condition serious enough to fault or stop execution, with recovery depending on the fault type | Read the exact fault type/code and fault history before clearing it | Studio 5000, TIA Portal, vendor diagnostics |
| I/O module connection fault | Controller I/O tree, module status, diagnostics | A configured module or remote I/O connection is missing, mismatched, faulted, or timed out | Identify the affected module and verify power, network, configuration, and connection status | Engineering software and module diagnostics |
| EtherNet/IP or PROFINET communication loss | PLC diagnostics, network/device status, HMI | A controller or device has lost cyclic communication with another node | Determine which connection is down and whether the device itself is powered and reachable | Studio 5000, TIA Portal, network diagnostics |
| VFD or servo fault | Drive display, HMI, drive status tags | The motion device detected a condition such as overcurrent, STO active, not ready, or feedback error | Record the exact drive code and current status before reset | Drive software, HMI, PLC tags, vendor manual |
| Safety circuit open | Safety HMI, safety controller, safety I/O status | One or more required safety conditions are not satisfied | Identify the open safety function using the approved safety diagnostic procedure | Safety engineering software and safety device diagnostics |
| Sequence timeout or step stuck | HMI alarm, sequence logic, state machine | A machine step did not receive the expected completion condition within its allowed time | Find the active step and the completion condition that never became true | PLC project, online monitoring, alarm diagnostics |
| Permissive or interlock not met | HMI, start logic, equipment status | One condition required to start or continue operation is false | Evaluate each permissive against its live value | PLC project and live tag monitoring |
| Watchdog or scan time overrun | Controller fault log, task diagnostics | A task or program did not complete within its configured execution window | Check task timing, loops, execution load, and the exact watchdog fault | Controller diagnostics and engineering software |
The table is useful because it prevents one common mistake: treating every red alarm banner as if it were the same type of problem. It is not. A drive code may require a manual. A custom sequence timeout requires the program.
On PackML machines the state itself narrows the search; see PackML explained.
How do you trace a custom HMI alarm through the PLC logic?
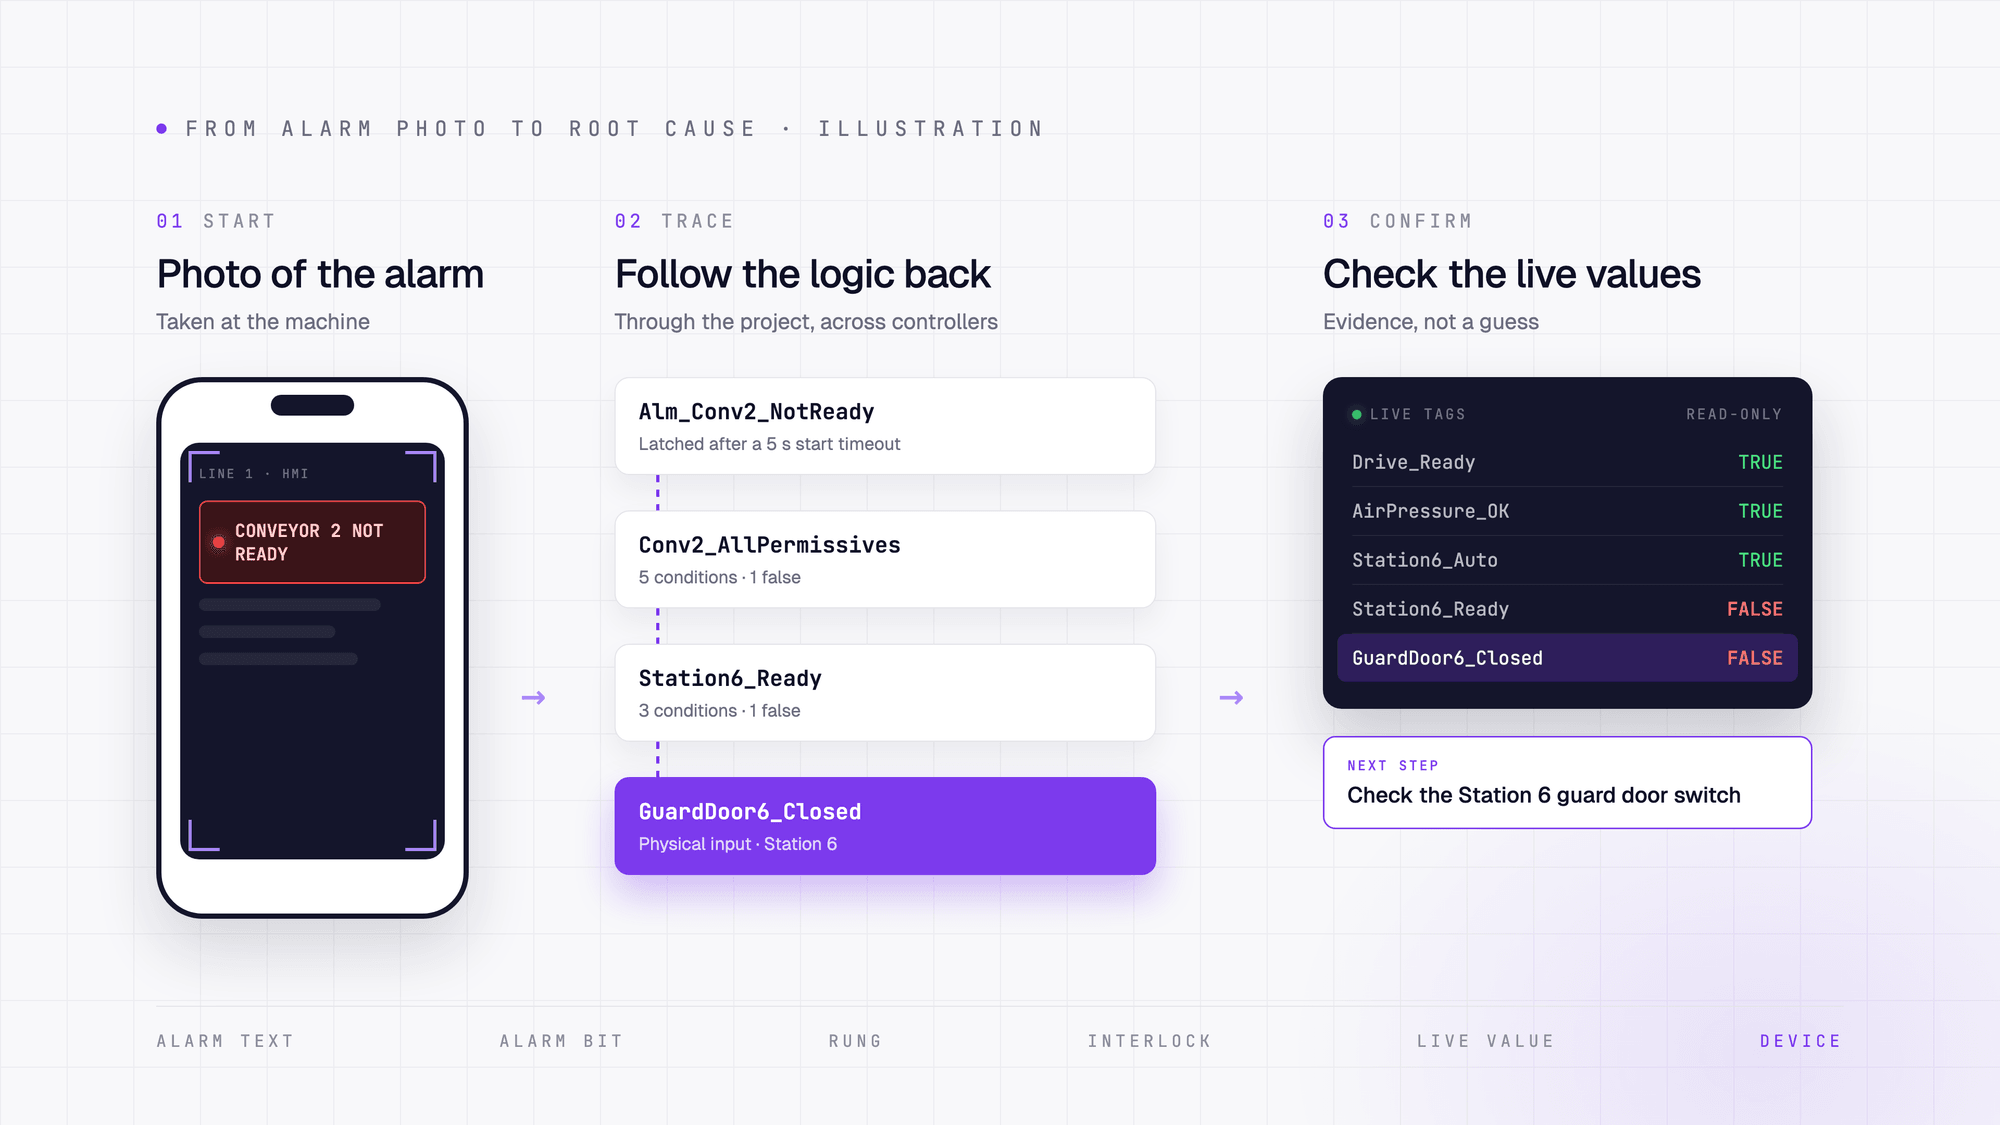
Start with the HMI message and identify the tag behind it. Cross-reference where that tag is set, inspect the logic that caused it, and follow each false interlock or permissive backward. Continue until the chain reaches a physical input or a value from another controller, then confirm the live value before checking the device. The six-step method:
- 01Find the alarm bit behind the HMI text. The HMI message is a label. Find the PLC tag, alarm array element, or expression that activates it.
- 02Cross-reference where that bit is set. Search the project for every OTE, OTL, assignment, function block output, or other write that can make the alarm true. Do not assume there is only one.
- 03Read the rung or logic that caused it. Determine what condition actually triggered the alarm. For a timeout, this may mean tracing the timer input rather than stopping at the timer done bit.
- 04Follow the failed interlock or permissive backward. If Conv2_AllPermissives is false, open it. If it depends on Station6_Ready, open that. Keep following the dependency chain.
- 05Confirm the live value. Logic tells you what should be true. Live data tells you what is true right now. Verify the relevant tags before deciding that you have found the cause.
- 06Check the physical device. Once the trace reaches an input, drive state, safety condition, or networked value, go to the actual device and verify the condition safely.
Worked example: “Conveyor 2 won’t start”
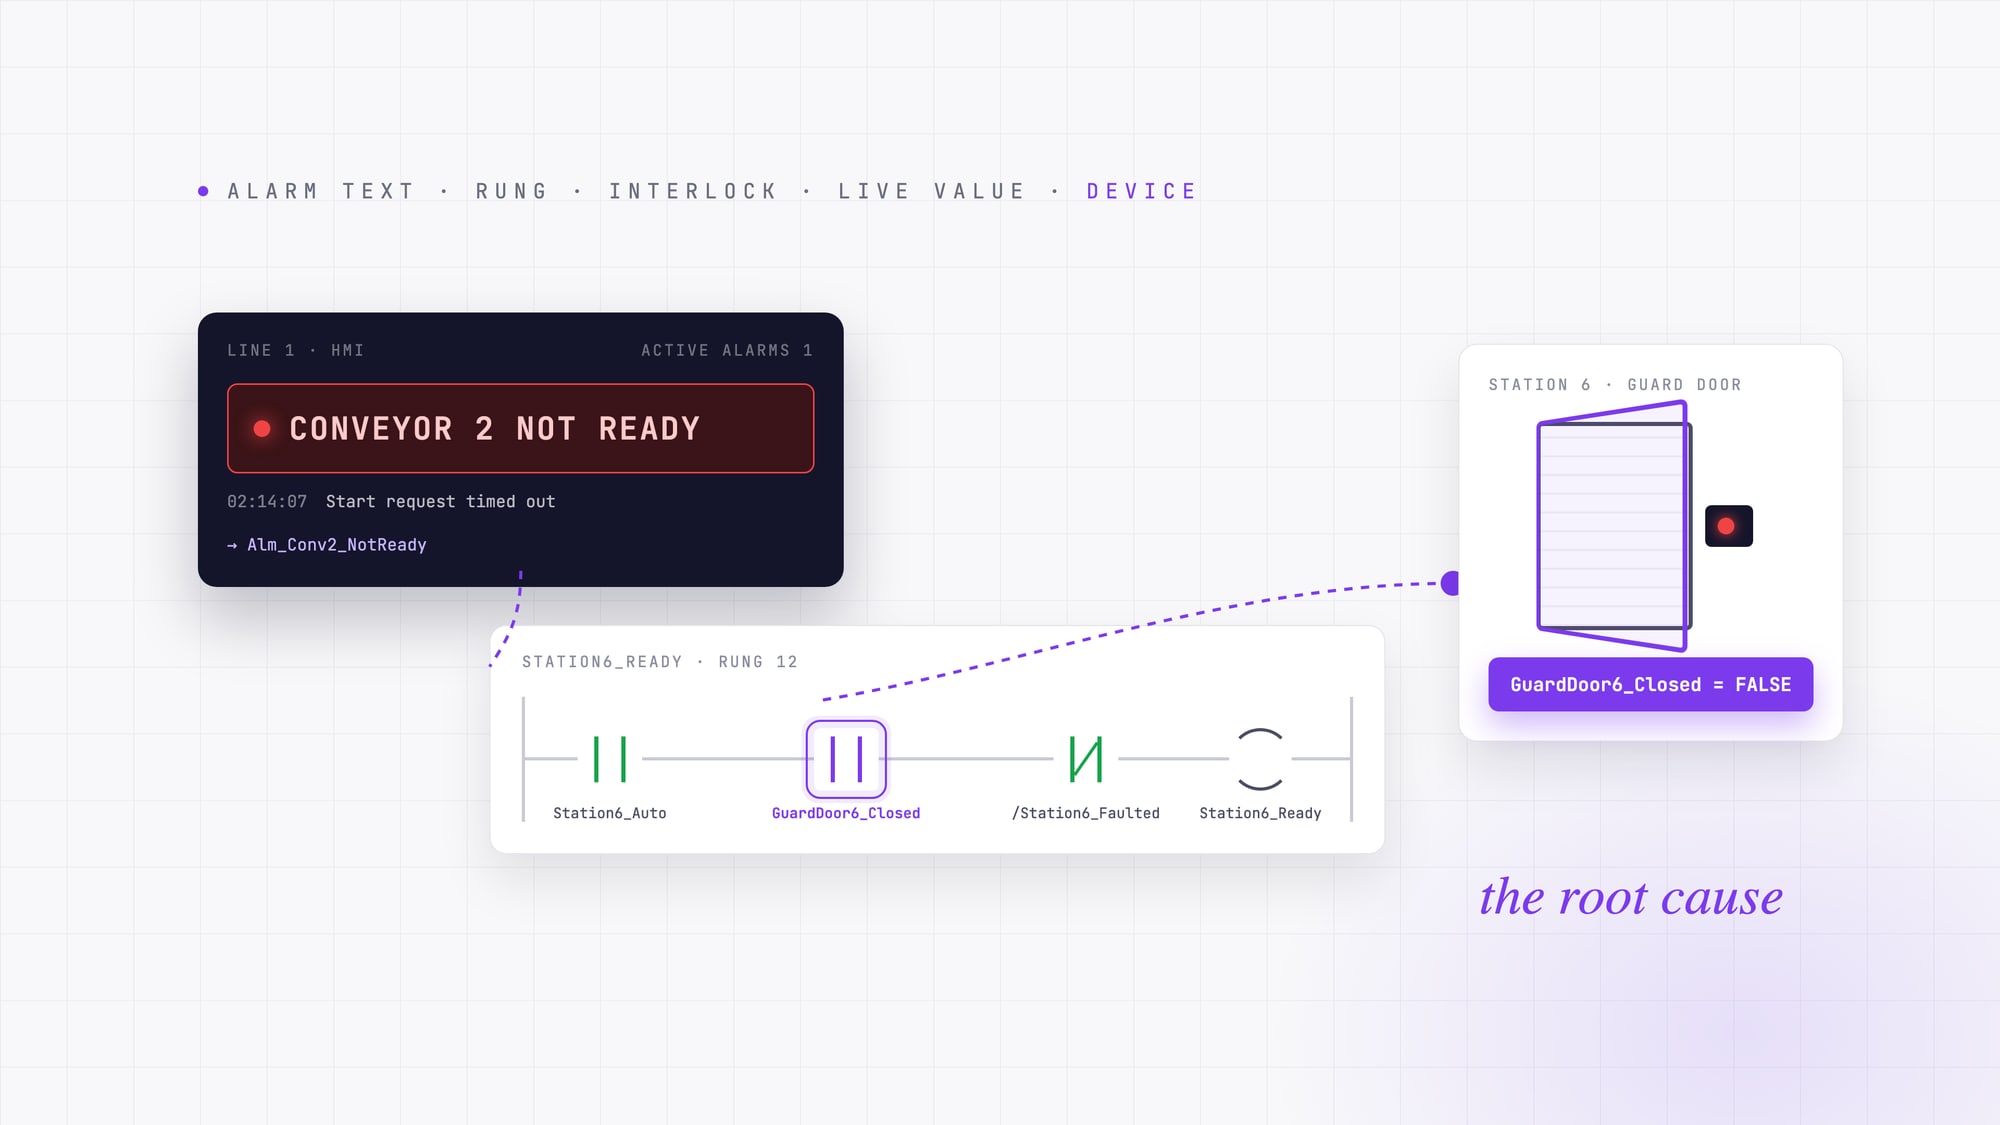
The operator presses Start. Conveyor 2 does not move. The HMI displays CONVEYOR 2 NOT READY. The first task is to find the tag behind that message: Alm_Conv2_NotReady.
A cross-reference shows that the alarm is latched when a start request remains active while the conveyor permissives are false long enough for a timeout:
XIC Conv2_StartRequest
XIO Conv2_AllPermissives
TON Conv2_StartTimeout  PRE 5000

XIC Conv2_StartTimeout.DN
OTL Alm_Conv2_NotReady
At this point we know more, but we still do not know the root cause. The alarm means:
Conveyor 2 received a start request, but all required start conditions were not satisfied within five seconds.
Next, trace Conv2_AllPermissives. Conceptually, the logic looks like this:
Conv2_AllPermissives =
    Drive_Ready
AND Downstream_Ready
AND AirPressure_OK
AND GuardCircuit_OK
AND Station6_ReadyDrive_Ready = TRUE Downstream_Ready = TRUE AirPressure_OK = TRUE GuardCircuit_OK = TRUE Station6_Ready = FALSE
Now the troubleshooting scope has collapsed from an entire conveyor to one condition. Cross-reference Station6_Ready:
Station6_Ready =
    Station6_Auto
AND GuardDoor6_Closed
AND NOT Station6_FaultedStation6_Auto = TRUE GuardDoor6_Closed = FALSE Station6_Faulted = FALSE
Now there is a concrete hypothesis:
Conveyor 2 cannot become ready because Station 6 is reporting its guard door as open.
The next step is physical verification. Check the Station 6 guard door and its approved safety diagnostics. The door may actually be open, the switch may be misaligned, a connector may be loose, or the input may be failing.
Notice what happened during the trace. We started with CONVEYOR 2 NOT READY. We ended with GuardDoor6_Closed = FALSE. That is the difference between reading an alarm and tracing a root cause.
If historical state is available, it can add another useful layer: when did GuardDoor6_Closed change relative to the stop? But a current live value alone does not prove when the condition changed, so do not infer timing unless the system has captured timestamped history.
Where the chain breaks on a real plant floor
On a drawing, alarm tracing looks linear. On a production line, it rarely is.
The alarm tag may be poorly named. It may be written in three different routines. A permissive may be buried inside an AOI or function block. The condition may originate in another PLC and arrive through a produced/consumed tag, MSG instruction, PROFINET exchange, OPC connection, or custom handshake. The actual path may look more like this:
HMI alarm → PLC A → line permissive → PLC B → safety status → remote I/O → field device
That becomes even harder on mixed-vendor PLC lines, where the dependency can cross different engineering environments and programming conventions.
Then there are practical constraints. The Studio 5000 or TIA Portal license may be on a laptop that is not at the machine. The latest project may not be obvious. Documentation may be years out of date. The engineer who originally wrote the sequence may have left the company.
This is where troubleshooting becomes a knowledge problem as much as a controls problem. The logic exists, but the people who know where to look, what the tags mean, and which machine interactions matter may be limited. That is the same challenge behind PLC tribal knowledge and retiring engineers.
Live data makes the trace significantly more useful because it turns static logic into evidence. For more on that distinction, see why real-time PLC data changes troubleshooting.
Which AI tools can explain a PLC fault code or HMI alarm?
AI tools help at different points in the troubleshooting chain. Vendor documentation and fault-code tools are useful for published device codes. Connected diagnostic tools can evaluate controller logic and live values. Whole-project tools add broader automation context, including relationships between controllers, projects, and the live machine state.
1. Manufacturer documentation and fault-code lookup
For a standard manufacturer fault, start with the exact controller, drive, or module, the firmware family if relevant, and the complete fault string. Rockwell’s documentation is the authoritative path for Logix controller and I/O fault codes. Siemens Industry Online Support and TIA Portal diagnostics provide the equivalent starting point for SIMATIC systems.
Tools such as KOEED AI Expert also accept industrial error codes and return diagnostic guidance across several automation brands. General-purpose models such as ChatGPT or Claude can help explain a documented code when given the exact model and complete code string.
These approaches are useful when the fault itself has a published definition. They are much less useful for Alm_Conv2_NotReady, because that alarm exists only inside your machine.
2. Connected alarm diagnostics
A second category connects diagnostic software to the controller itself. AlarmIQ by PulseMQ, for example, says it reads the PLC program and live controller state, automatically discovers alarms and interlocks, and recursively traces an active alarm through timers, branches, intermediate logic, and live values toward physical I/O. Its currently listed available support is Allen-Bradley ControlLogix and CompactLogix, with Siemens support listed as coming soon.
That is fundamentally different from entering a fault code into a lookup box: the tool has access to machine-specific logic and live state. The important evaluation question for any tool in this category is not simply “Does it use AI?” Ask:
What automation context can it actually see?
3. Whole-project and line-context AI
For complex troubleshooting, the relevant context may extend beyond the controller displaying the alarm.
PLCs.ai, AI PLC troubleshooting reads the whole Studio 5000, TIA Portal, or CODESYS V3 project, traces the alarm through interlocks across every controller on the line, confirms the cause against live tag values from the Desktop Companion App, and can use a phone photo of the HMI alarm screen as the starting point.
The objective is not simply to explain what an alarm normally means. It is to determine why this specific machine, with this project, these dependencies, and these live values, is producing it.
That broader context matters when the alarm is in PLC A but the missing condition comes from PLC B, when a line permissive depends on another machine, or when the same tag name means something different across projects.
On PackML machines, the standard’s state model gives that context a shared structure. Our white paper PackML in the AI Era shows how AI uses it, from compliance checks to line-level troubleshooting.
For a deeper field workflow, see the PLC troubleshooting guide and the main PLC troubleshooting page.
What not to do when an alarm is active
Alarm troubleshooting should reduce uncertainty, not create new risk.
- 01Do not repeatedly reset a fault or alarm without understanding why it occurred. Record the code and relevant state first, then follow the machine’s approved recovery procedure.
- 02Never bypass or force a safety input simply to test a theory. Use the approved safety diagnostic process and qualified personnel.
- 03Do not paste AI-generated logic directly into a running controller. Any proposed change should go through the same engineering review, validation, testing, backup, and change-control process as any other controls change.
- 04Treat AI output as a hypothesis until the evidence confirms it. Verify the PLC value, the logic path, and the physical condition at the device.
The fastest answer is not useful if it is not a safe, verifiable answer.
Trace the alarm instead of guessing
When the HMI says “not ready,” “sequence timeout,” or “permissive missing,” the text is only the beginning. The useful chain is:
Alarm text → alarm bit → rung → failed interlock → live value → physical device
PLCs.ai is designed to make that chain accessible without requiring every person standing at the stopped machine to manually navigate a large PLC project. Photograph the alarm screen. Upload the project. Trace the chain.
Start a PLCs.ai trial →Explore the PLC troubleshooting workflow →Frequently asked questions
What is the difference between a PLC fault and an HMI alarm?
A PLC fault is typically generated by the controller, module, drive, safety system, or another device when it detects a defined fault condition. An HMI alarm may simply display a custom Boolean condition created by the machine programmer. Manufacturer faults can often be looked up; custom machine alarms usually have to be traced through the PLC logic.
How do I find which rung sets an HMI alarm?
Find the tag or expression behind the HMI alarm message, then cross-reference that tag in the PLC project. Look for every instruction or assignment that can write it, including latch instructions and function block outputs. Once you find the write location, trace the triggering conditions backward through the logic.
What does a major recoverable fault mean on an Allen-Bradley PLC?
A major recoverable fault is a controller fault classified by Rockwell as recoverable rather than non-recoverable. The correct response depends on the exact fault Type and Code. Record the complete Txx:Cxx code and review Rockwell’s Logix fault documentation before clearing the fault or restarting the controller.
How do I read the Siemens diagnostic buffer?
In TIA Portal, connect to the PLC, open Online & diagnostics, and select Diagnostic buffer to review diagnostic events recorded by the CPU. The buffer can help identify hardware, communication, program, and system events. Use the event details and timestamps as the starting point for further troubleshooting.
Can AI explain a PLC fault code?
Yes, especially when the fault is a documented manufacturer code and you provide the exact device model and complete code. The harder problem is a custom machine alarm. Explaining that reliably may require access to the PLC project, the logic behind the alarm, and ideally the live values associated with the failed conditions.
Why does an alarm come back after I reset it?
Usually because resetting the alarm cleared the indication or latch but did not remove the condition that causes it. If a guard remains open, a drive remains not ready, or a permissive is still false, the PLC logic can set the alarm again on the next scan or when the sequence retries.
Can a fault on one PLC stop a different machine?
Yes. Production equipment often exchanges ready, faulted, blocked, starved, safety, and sequence states between controllers. A condition originating in one PLC can therefore remove a permissive in another PLC and stop equipment elsewhere on the line. Troubleshooting requires following the signal across the controller boundary.
How do you troubleshoot a PLC alarm without the programming software?
Start by recording the complete alarm text, fault code, device model, machine state, and any related alarms before resetting anything. Manufacturer documentation can help with standard device faults. For custom machine alarms, however, finding the true logic path usually requires access to the PLC project or a diagnostic platform that can interpret the project and controller state.
More from the blog
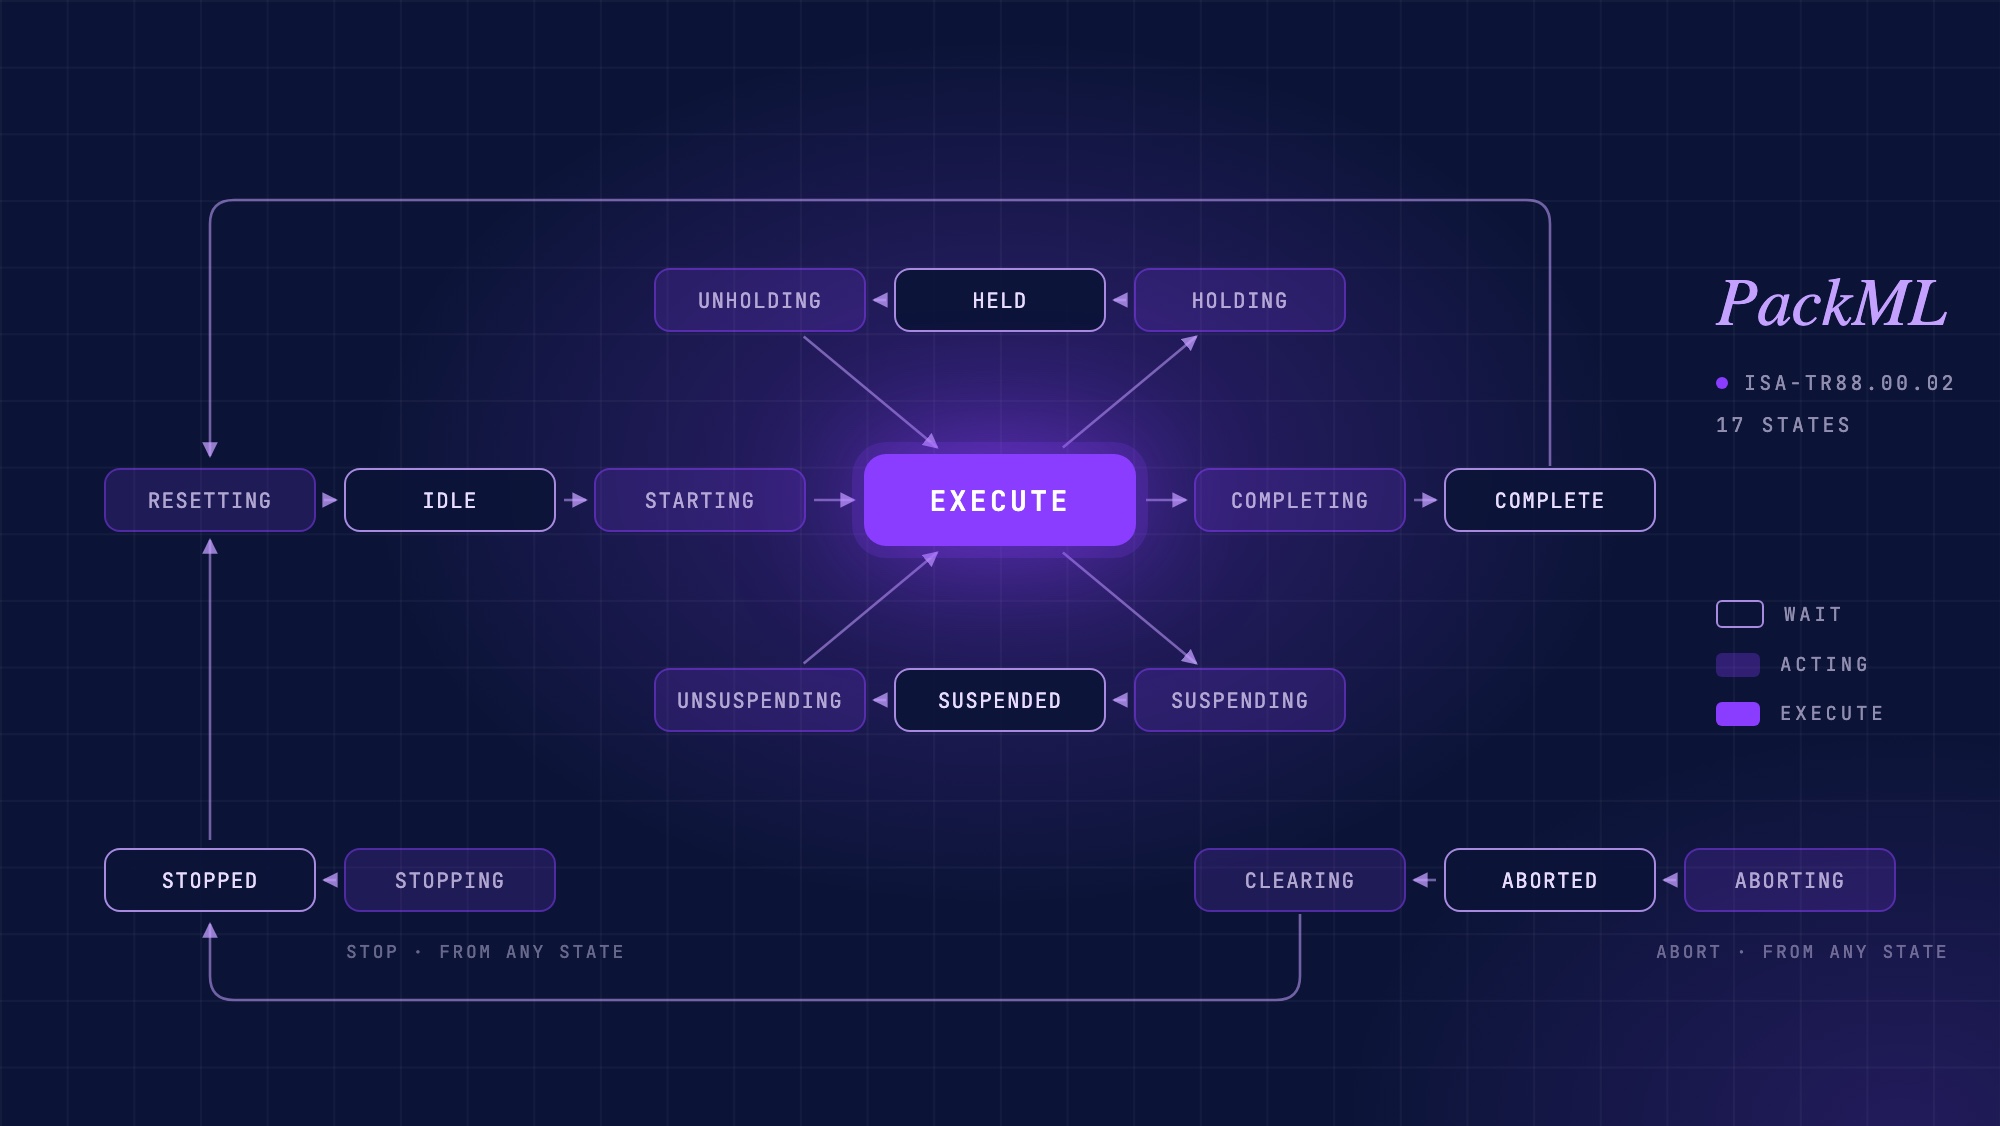
PackML explained: the state model, PackTags, and where AI fits
What PackML is, how the 17-state machine, modes and PackTags work, how to check whether a PLC project really follows it, and where AI helps.
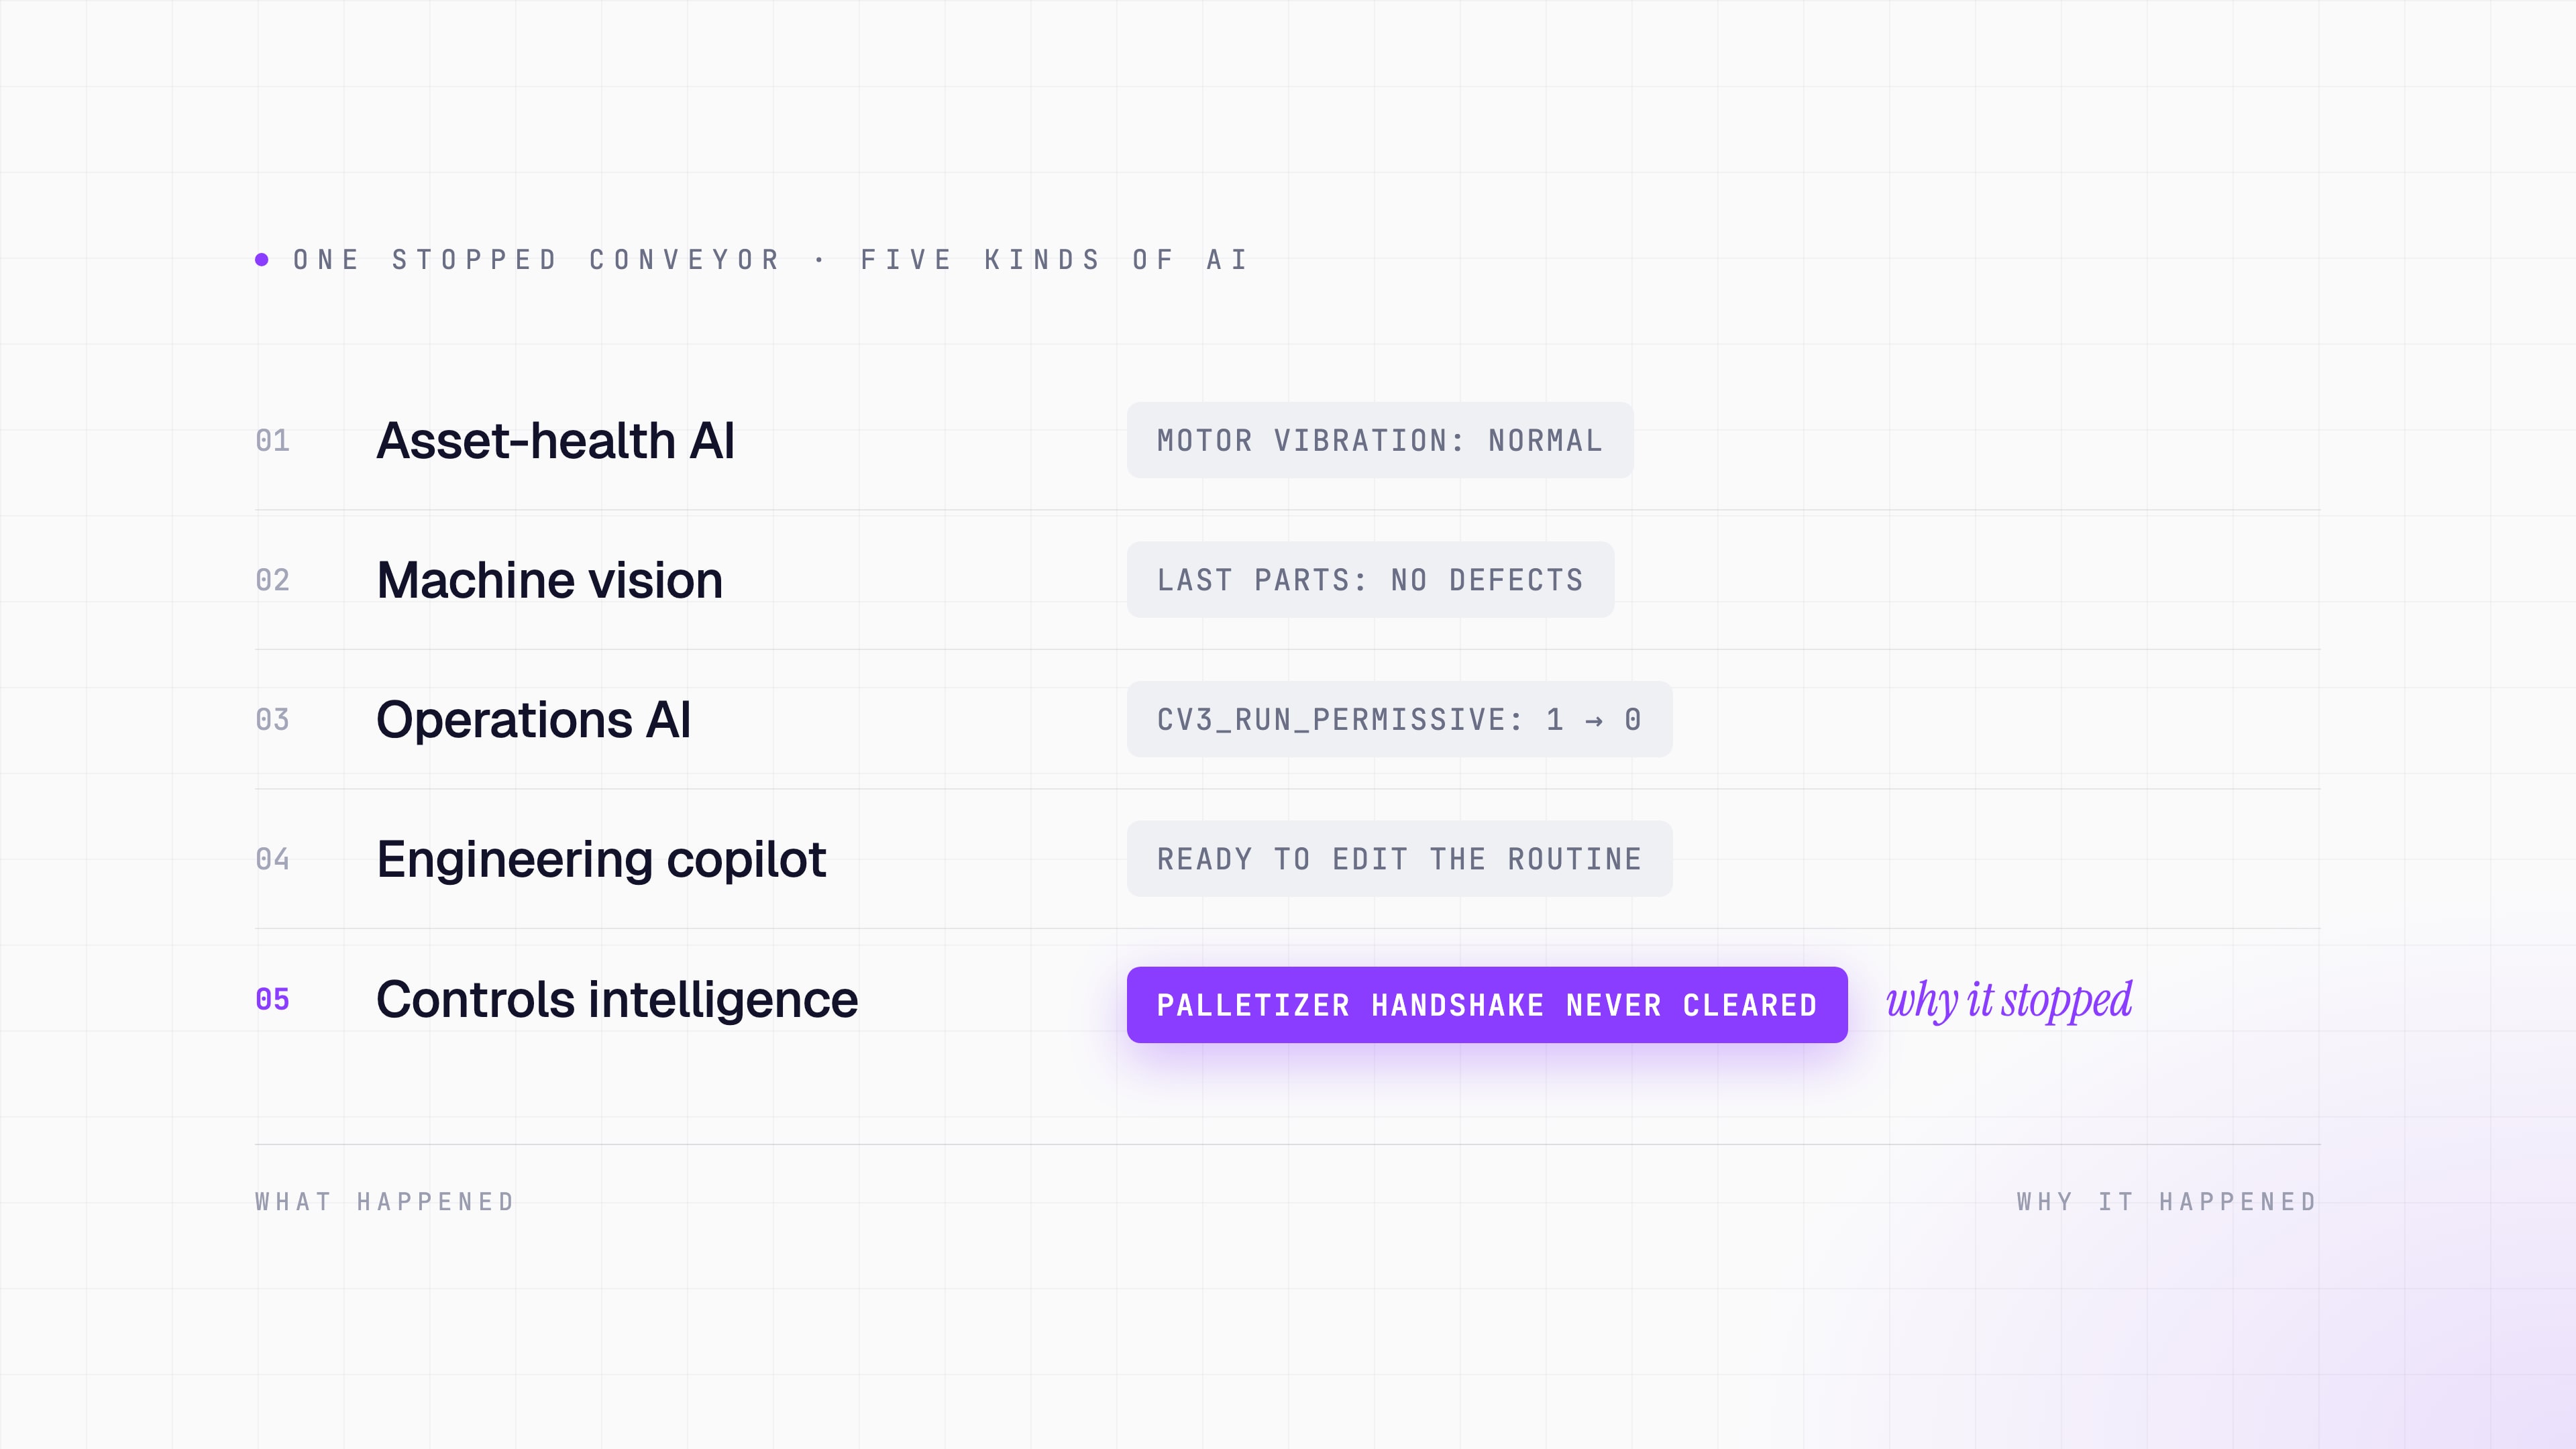
What is the best AI for industrial automation in 2026?
There is no single best AI for industrial automation. Compare industrial AI by the problem it solves, from machine vision to PLC troubleshooting.
PLC documentation software: 9 tools compared (2026).
Automatic PLC documentation ranges from deterministic tools that reformat what is already in the project, to AI that infers meaning from undocumented code, to platforms that generate documentation from a broader understanding of the automation system. Nine real tools, compared on what they actually do.