
How to reduce MTTR in manufacturing: fix the hour nobody measures.
The average plant repairs an unplanned stop in 65 minutes, and most of that hour is not repair at all. A practical playbook for cutting MTTR by attacking diagnosis, the phase most plants do not even measure.
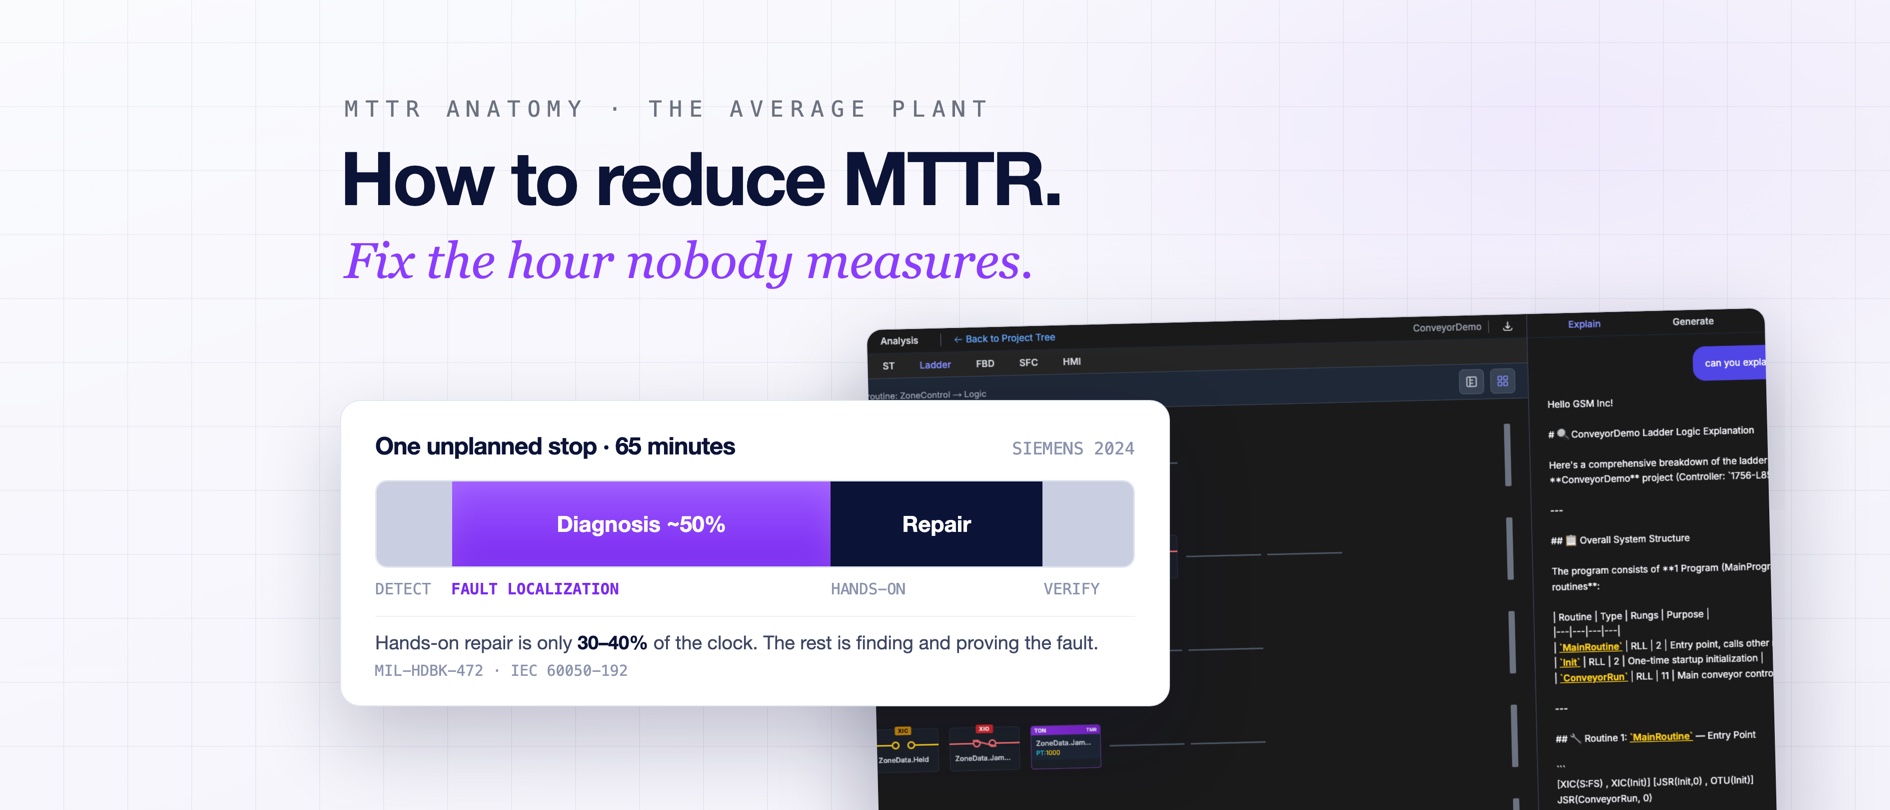
Mean time to repair is the metric plant managers stare at and the one they have the least leverage on, because the standard playbook (more spares, more training, faster dispatch) attacks the smallest part of the clock. This post is about the biggest part: the share of every repair that is spent finding the fault rather than fixing it, and the five levers that actually shrink it.
What is MTTR and how is it calculated?
MTTR is total unplanned repair time divided by the number of repairs over a period. If your line logged 20 stops last month and 22 hours of repair time, your MTTR is 66 minutes. The benchmark: Siemens' True Cost of Downtime report (2024) finds the average large plant has 25 unplanned stops and 27 lost hours a month, which works out to about 65 minutes per stop. (Siemens separately reports that getting production running again now takes 81 minutes on average, up from 49 in 2019.) If you are near that number, you are average, and average is expensive: at the same report's cost figures, each month of average performance is 27 hours of lost production.
Where does the repair hour actually go?
Reliability engineering splits repair time into phases, and the split is the whole story. IEC 60050-192 defines active corrective maintenance time as fault localization, fault diagnosis, fault correction and function check-out, and MIL-HDBK-472 breaks repair down the same way. Neither standard puts a fixed percentage on each phase, but the pattern maintenance teams describe is consistent: hands-on correction is the smaller part of the clock. The rest is detection, diagnosis, and verification: figuring out what is wrong, and proving the fix worked.
| Phase | Typical share (practitioner estimate) | What most plants do about it |
|---|---|---|
| Detection | ~10% | Andon, alarms (usually covered) |
| Diagnosis / fault localization | ~40–55% | Almost nothing |
| Correction (hands-on repair) | ~30–40% | Spares, training, dispatch |
| Verification / check-out | ~10–15% | Almost nothing |
Read the table again with a manager's eye: nearly every dollar plants spend on MTTR targets the one phase that is already the smallest. The diagnosis phase, the biggest single block of the clock, usually is not even measured separately. That is the hour nobody owns.
The five levers that actually cut MTTR
- 01Measure the split. Log diagnosis time separately from repair time for one month. The number will justify everything else on this list.
- 02Give techs a systematic fault-finding method. A written, ordered procedure (LEDs, comms, power, I/O, forces, fault logs, logic trace, verify) turns the diagnosis lottery into a process.
- 03Make the control logic legible. Most diagnosis time on PLC-controlled equipment is spent working out what the program expects. Documentation that explains what each routine does, generated and kept current automatically, removes the archaeology.
- 04Ground diagnosis in live controller data. A theory confirmed against live tag values in seconds replaces a walk to the panel per candidate cause. This is where AI for PLC troubleshooting earns its keep: it reads the whole program and checks its reasoning against the running controller.
- 05Capture what the fix taught you. Every resolved fault that lives only in one technician's memory will be re-diagnosed from scratch by the next shift. Version the insight with the code.
MTTR vs MTBF: which should you attack first?
MTBF (mean time between failures) is about preventing stops; MTTR is about surviving them. Prevention programs are multi-year capital efforts. The diagnosis share of MTTR, by contrast, is software and method: it can move within a quarter, without touching the machines. For most plants the fastest downtime win available is cutting the part of repair time that is not repair at all.
The arithmetic is compelling. At the average 25 stops and 65-minute MTTR, cutting diagnosis in half saves roughly 8 hours of downtime per month, and at published downtime costs that is roughly $290,000 to $18 million a month depending on your industry. Price your own number with the calculator below; every default is sourced.
Price your downtime hour with the free calculator →The eight-step PLC troubleshooting method →AI PLC troubleshooting: how the diagnosis hour becomes minutes →More from the blog
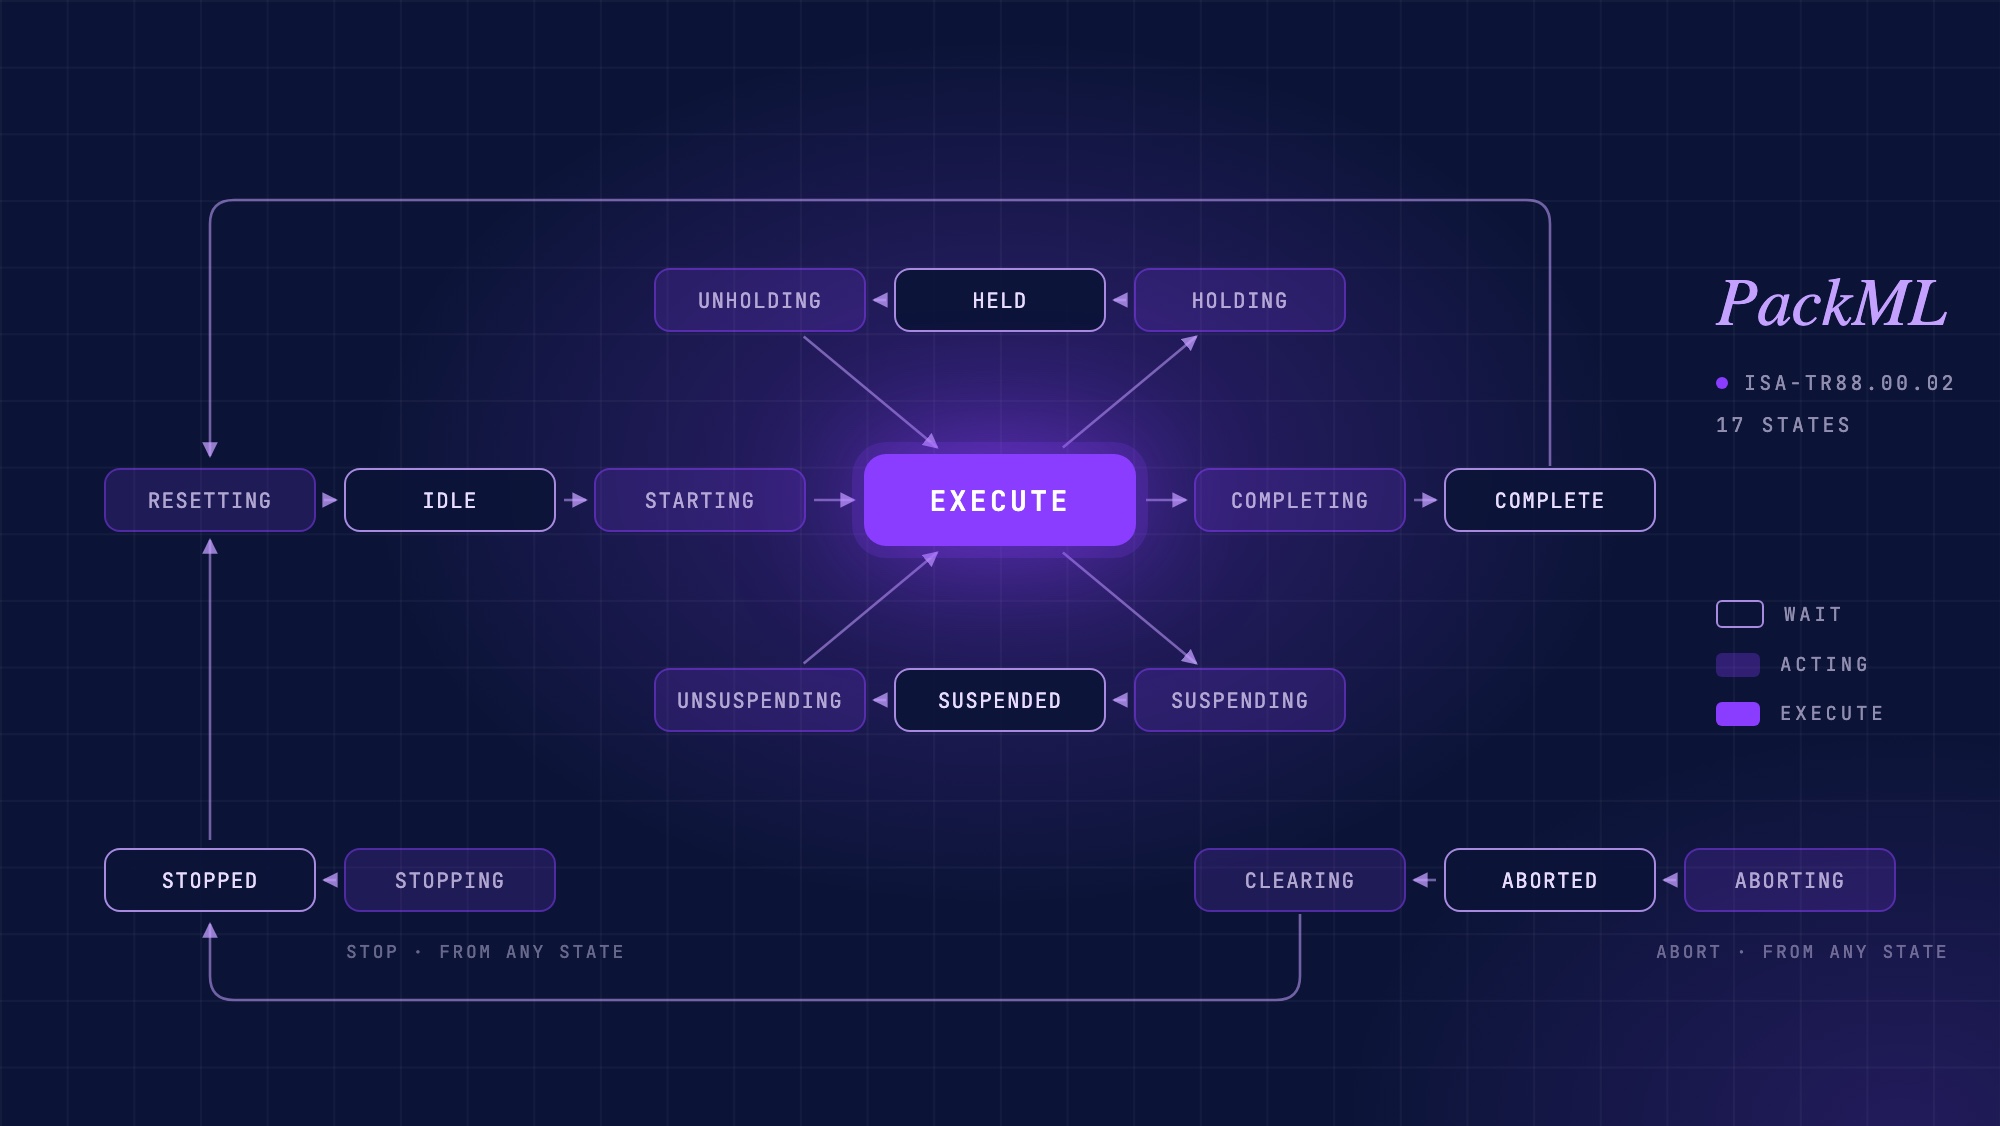
PackML explained: the state model, PackTags, and where AI fits
What PackML is, how the 17-state machine, modes and PackTags work, how to check whether a PLC project really follows it, and where AI helps.
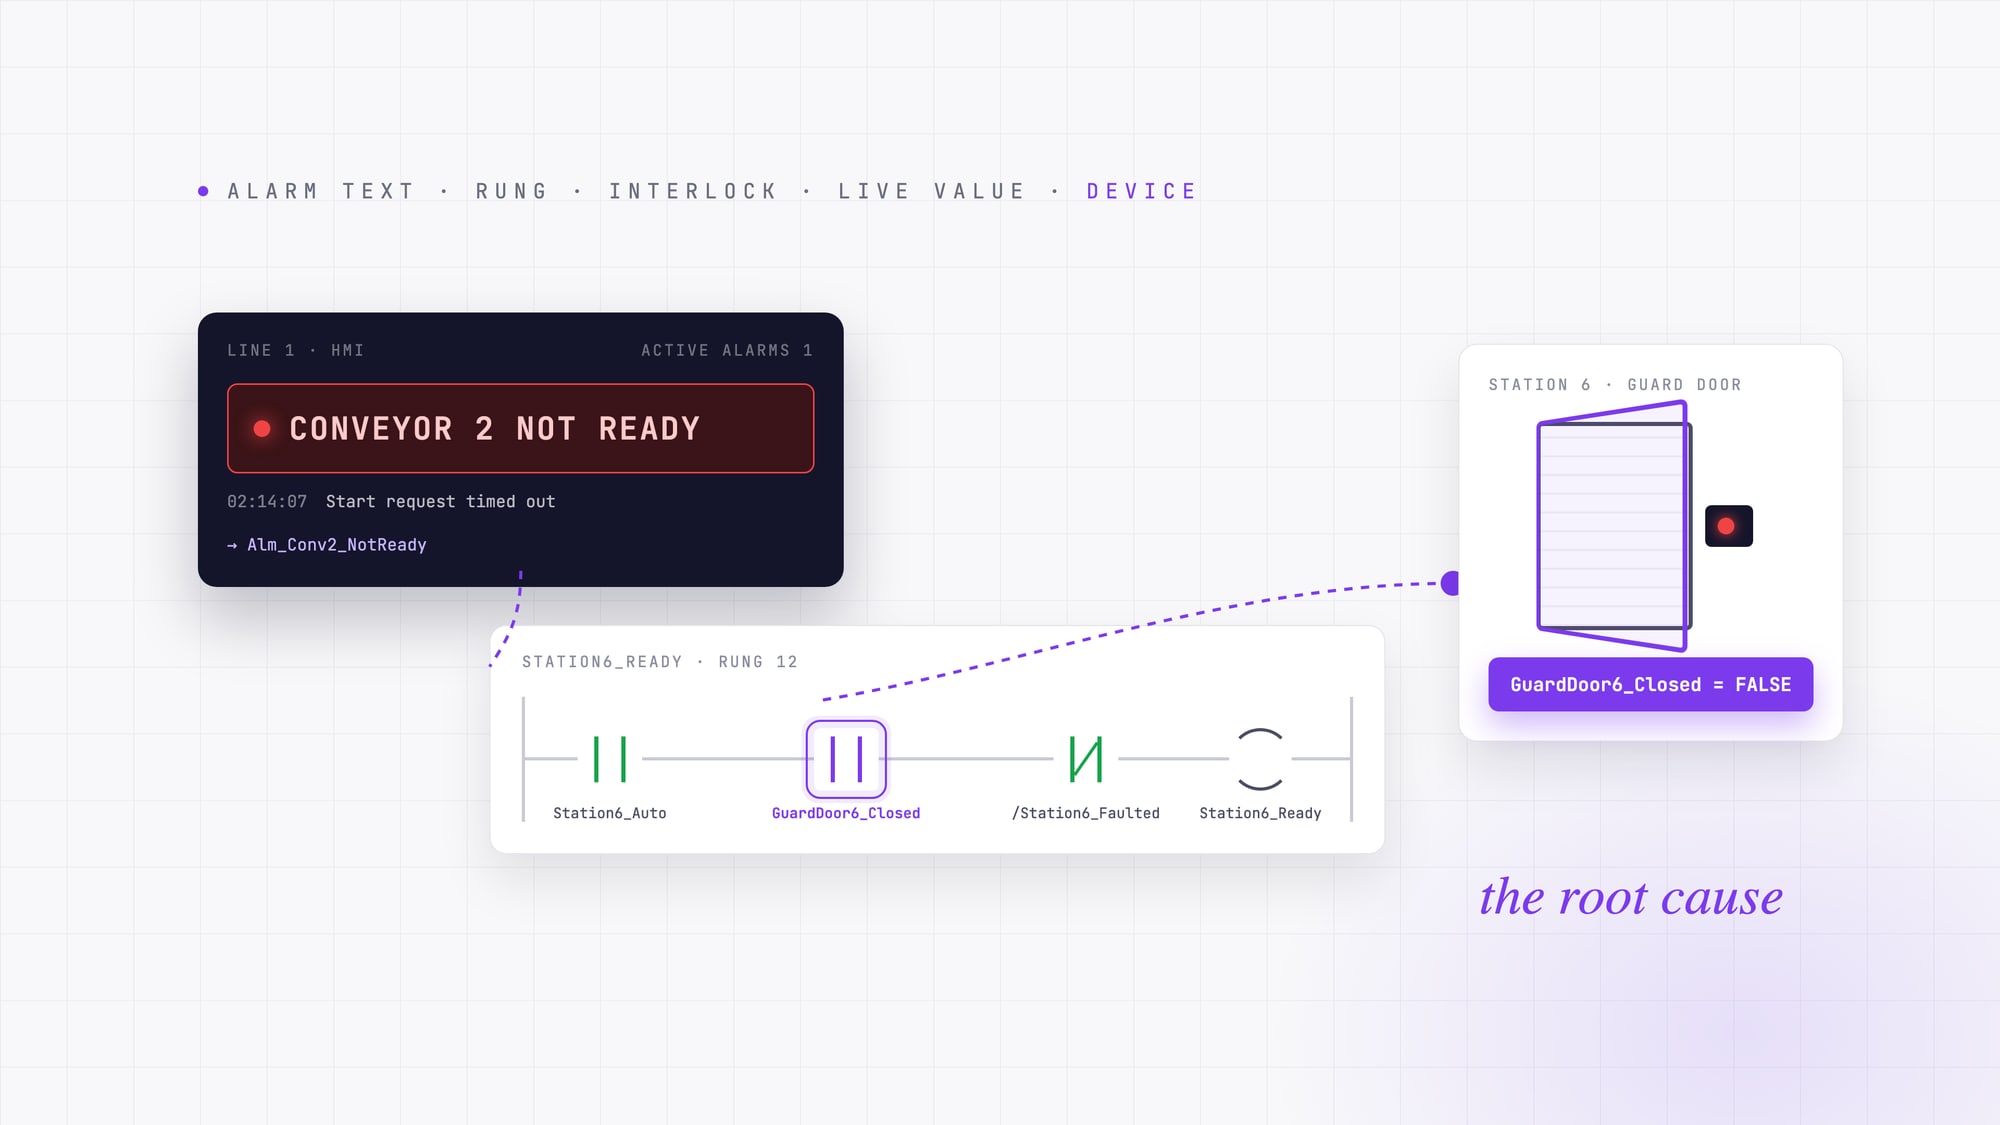
PLC fault codes and HMI alarms: how to trace an alarm back to its root cause
A PLC fault code or HMI alarm tells you where troubleshooting starts, not why the machine stopped. A field method for tracing an alarm from its text to the device behind it.

What is the best AI for industrial automation in 2026?
There is no single best AI for industrial automation. Compare industrial AI by the problem it solves, from machine vision to PLC troubleshooting.